


Printable Log-Log Graph Paper
Full logarithmic graph paper with log scales on both axes, for power laws, scaling relationships and wide-ranging data.
Print at “Actual size” or 100% scale so the spacing comes out exactly as set. Everything is made in your browser; nothing is uploaded.
Ready-made Log-log graph paper PDFs
Just need one sheet? Download a finished template in Letter or A4.
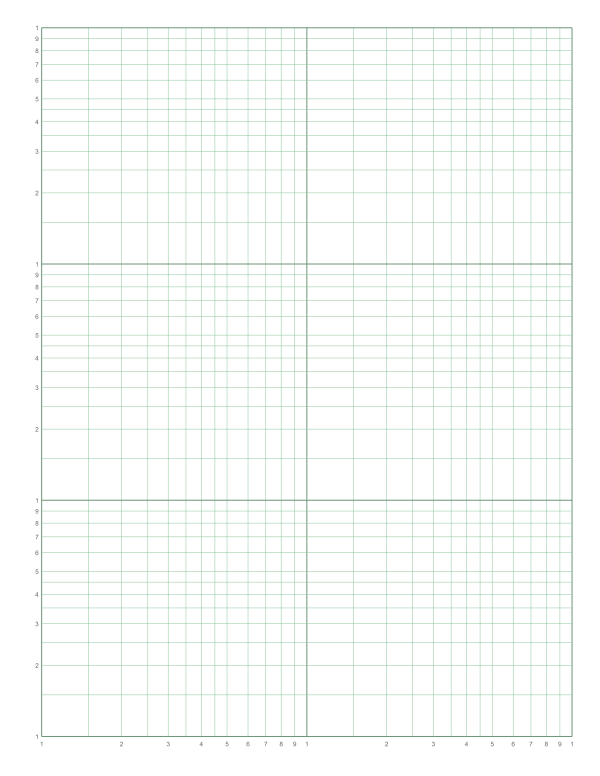 Log-log, 2 × 3 cycles
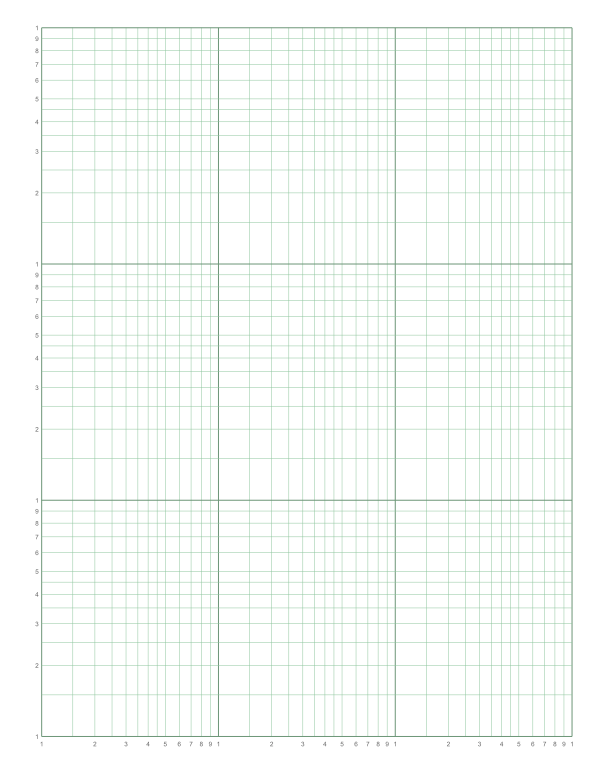 Log-log, 3 × 3 cycles
How to make log-log graph paper
- Set horizontal cycles One cycle for each power of ten across the x data.
- Set vertical cycles One cycle for each power of ten in the y data.
- Style the page Pick paper size, orientation and line color.
- Print or download Download the PDF and print at actual size.
Power laws become straight lines
A relationship of the form y = a·xn plots as a straight line on log-log paper, and the slope of that line is the exponent n. Measure the slope with a ruler as rise over run in the same physical units (centimetres or inches), not in axis values, as long as both axes use the same cycle length. A slope of 2 means y grows with the square of x; a slope of −1 means y is inversely proportional to x.
Where log-log paper is used
- Physics labs: pendulum period against length (slope ½), intensity against distance (slope −2).
- Biology: metabolic rate against body mass, and other scaling laws.
- Engineering: fatigue (S-N) curves, friction factor charts, sieve analysis in soil mechanics.
- Any data covering several orders of magnitude on both axes.
Choosing cycles
Count the powers of ten each variable spans and set the cycles separately for each axis. With equal cycle counts on both axes and a square page area the decades are close to square, which makes slopes easy to read.
Frequently asked questions
What is log-log graph paper used for?
For plotting relationships of the form y = a·xⁿ, which appear as straight lines, and for data that spans several powers of ten on both axes.
How do I find the exponent from a log-log plot?
Measure the slope of the straight line with a ruler (rise over run in physical length). The slope equals the exponent n.
What is the difference between semi-log and log-log paper?
Semi-log paper has one log axis and one linear axis; log-log paper has log scales on both.
Can I plot negative values on log-log paper?
No. Logarithmic axes start above zero, so negative values and zero cannot be plotted directly.
Can I print log-log paper on A4?
Yes. Choose A4 in the generator and print at Actual size; the cycle spacing stays the same.
 Semi-log graph paper
 Graph paper
 Engineering paper
 Coordinate plane