


Printable Semi-Log Graph Paper
Graph paper with a logarithmic scale on one axis and a linear scale on the other, for exponential growth and decay, Bode plots and lab data.
Print at “Actual size” or 100% scale so the spacing comes out exactly as set. Everything is made in your browser; nothing is uploaded.
Ready-made Semi-log graph paper PDFs
Just need one sheet? Download a finished template in Letter or A4.
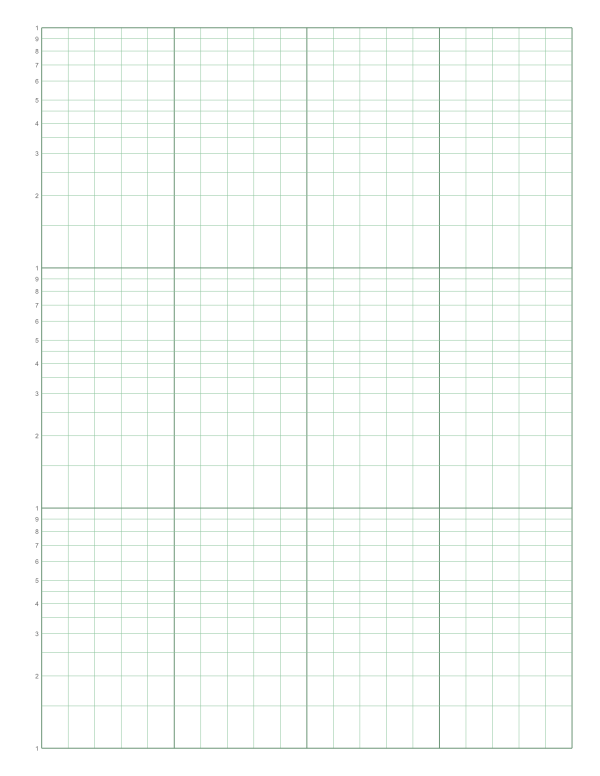 Semi-log, 3 cycles
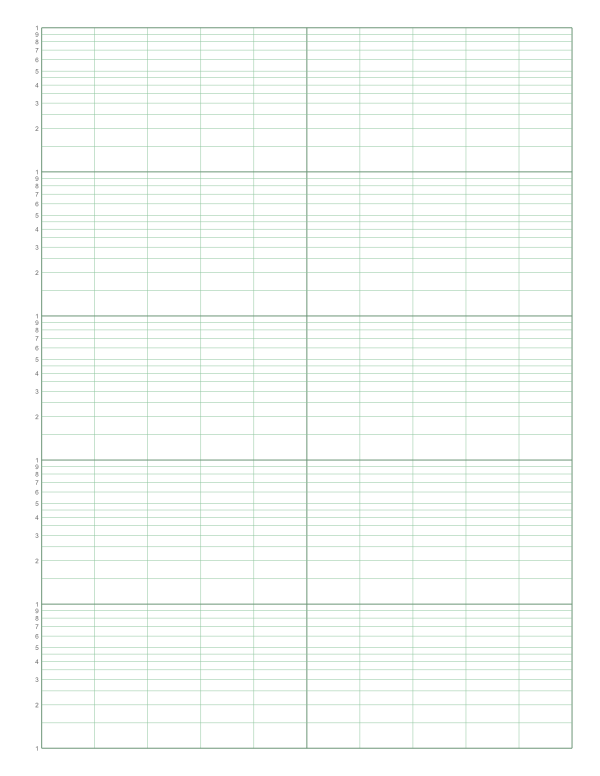 Semi-log, 5 cycles
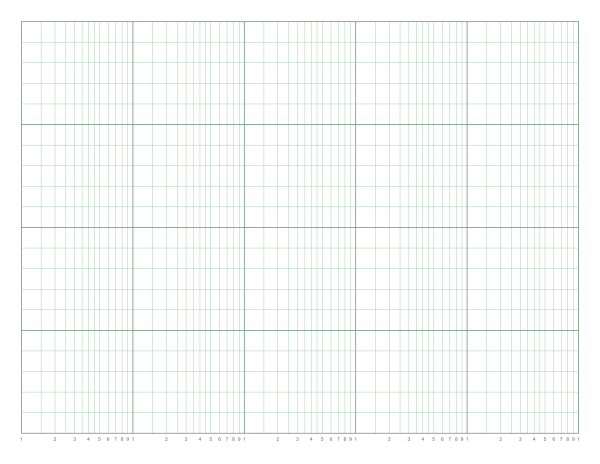 Bode plot paper
How to make semi-log graph paper
- Choose the cycles Each cycle covers one power of ten. Pick enough cycles for the range of your data.
- Choose the log axis Vertical for growth and decay data, horizontal for frequency plots such as Bode diagrams.
- Set the linear divisions From 10 to 50 divisions along the linear axis.
- Print or download Download the PDF and print at actual size.
What a log cycle is
On a logarithmic axis every power of ten takes the same distance. One cycle (or decade) runs from 1 to 10, the next from 10 to 100, and so on. The printed labels 1 to 9 repeat in every cycle; you multiply them by the power of ten for that cycle. Count how many powers of ten your data spans: values from 2 to 5,000 cover 1–10, 10–100, 100–1,000 and 1,000–10,000, so you need four cycles.
Why use semi-log paper?
Exponential relationships, y = a·bx, become straight lines when y is plotted on a log scale. That makes semi-log paper the standard way to:
- check whether data grows or decays exponentially (bacteria growth, radioactive decay, compound interest, capacitor discharge),
- read a growth rate or half-life from the slope of a straight line,
- draw Bode plots, where frequency goes on a log x-axis and gain in decibels on a linear y-axis.
The Bode plot preset puts five cycles across a landscape page, enough for 10 Hz to 1 MHz.
Reading the scale
Between 1 and 10 the lines get closer together: the gap from 1 to 2 is about 30% of the cycle, while the gap from 9 to 10 is under 5%. Half-step lines at 1.5, 2.5, 3.5 and 4.5 help with the wide intervals. Never interpolate linearly between log lines; use the printed sub-lines instead.
Frequently asked questions
What is semi-log graph paper?
Graph paper where one axis has a logarithmic scale and the other a normal linear scale.
How many cycles do I need?
One cycle per power of ten in your data. Data from 1 to 1,000 needs three cycles.
Can there be a zero on a log axis?
No. A log scale never reaches zero; the first cycle starts at 1 times a power of ten that you choose, such as 0.01, 1 or 100.
What paper is used for Bode plots?
Semi-log paper with the log scale on the horizontal axis for frequency. Use the Bode plot preset.
Can semi-log paper show exponential growth?
Yes. Exponential growth appears as a straight line on semi-log paper, which makes the growth rate easy to compare.
 Log-log graph paper
 Graph paper
 Engineering paper
 Polar graph paper