


Columns and values
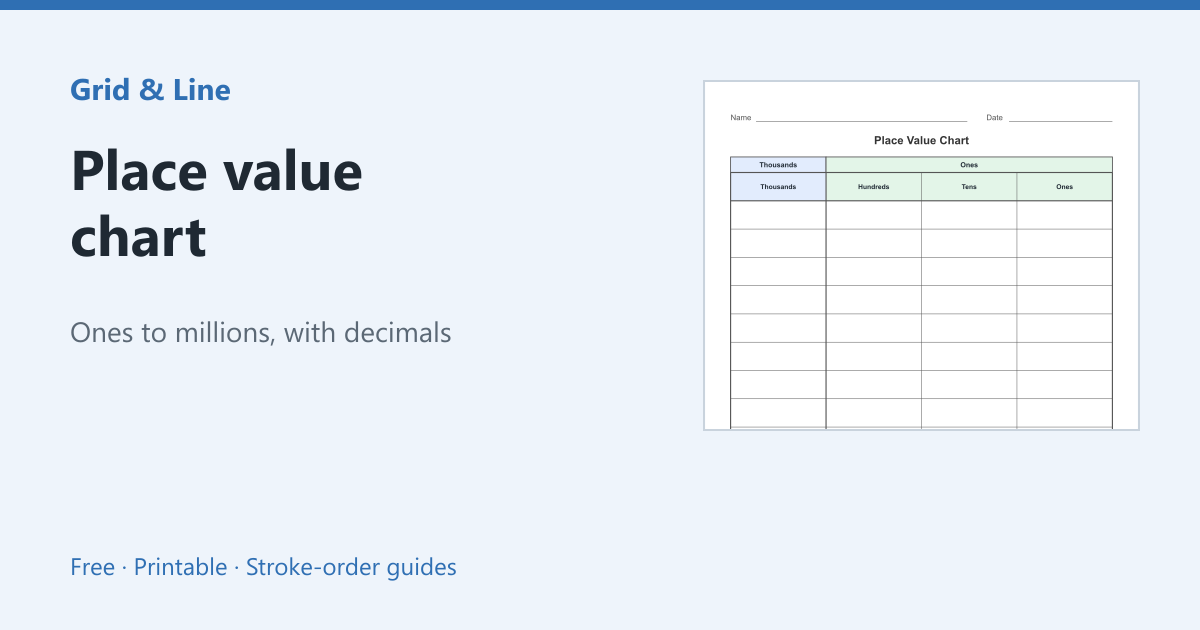
| Millions | Hundred thousands | Ten thousands | Thousands | Hundreds | Tens | Ones |
|---|---|---|---|---|---|---|
| 1,000,000 | 100,000 | 10,000 | 1,000 | 100 | 10 | 1 |
Each column is ten times the column to its right. That is why moving one place left multiplies by ten.
Decimals
To the right of the decimal point, the columns are tenths, hundredths and thousandths. The decimal point sits between ones and tenths. Write 4.27 with 4 in ones, 2 in tenths and 7 in hundredths.
Regrouping and expanded form
A chart makes carrying and borrowing visible: ten ones become one ten, ten tens become one hundred. It also supports expanded form, where 3,482 is written as 3,000 + 400 + 80 + 2. The place value chart generator prints whole-number and decimal versions.
In practice
A student writes 4.7 as 4.07. The place value chart shows that the first column after the decimal is tenths, not hundredths. Writing the digits into labelled columns before saying the number makes the decimal point meaningful.
Common mistakes
| Problem | Usually because | What to do |
|---|---|---|
| The decimal point moves | Columns are not labelled | Write the point between ones and tenths first |
| A zero is omitted | The empty place is skipped | Use a zero placeholder |
| Regrouping loses a ten | The exchange is done mentally | Cross out and rewrite in the chart |
 Place value chart
 Hundreds chart
 Multiplication chart